
Maths
>
GCSE
>
Rates of Change
>
How do you...
How do you find the rate of change?
2 years ago
·
215 Replies
·
10548 views
Vickie Shanahan
215 Answers
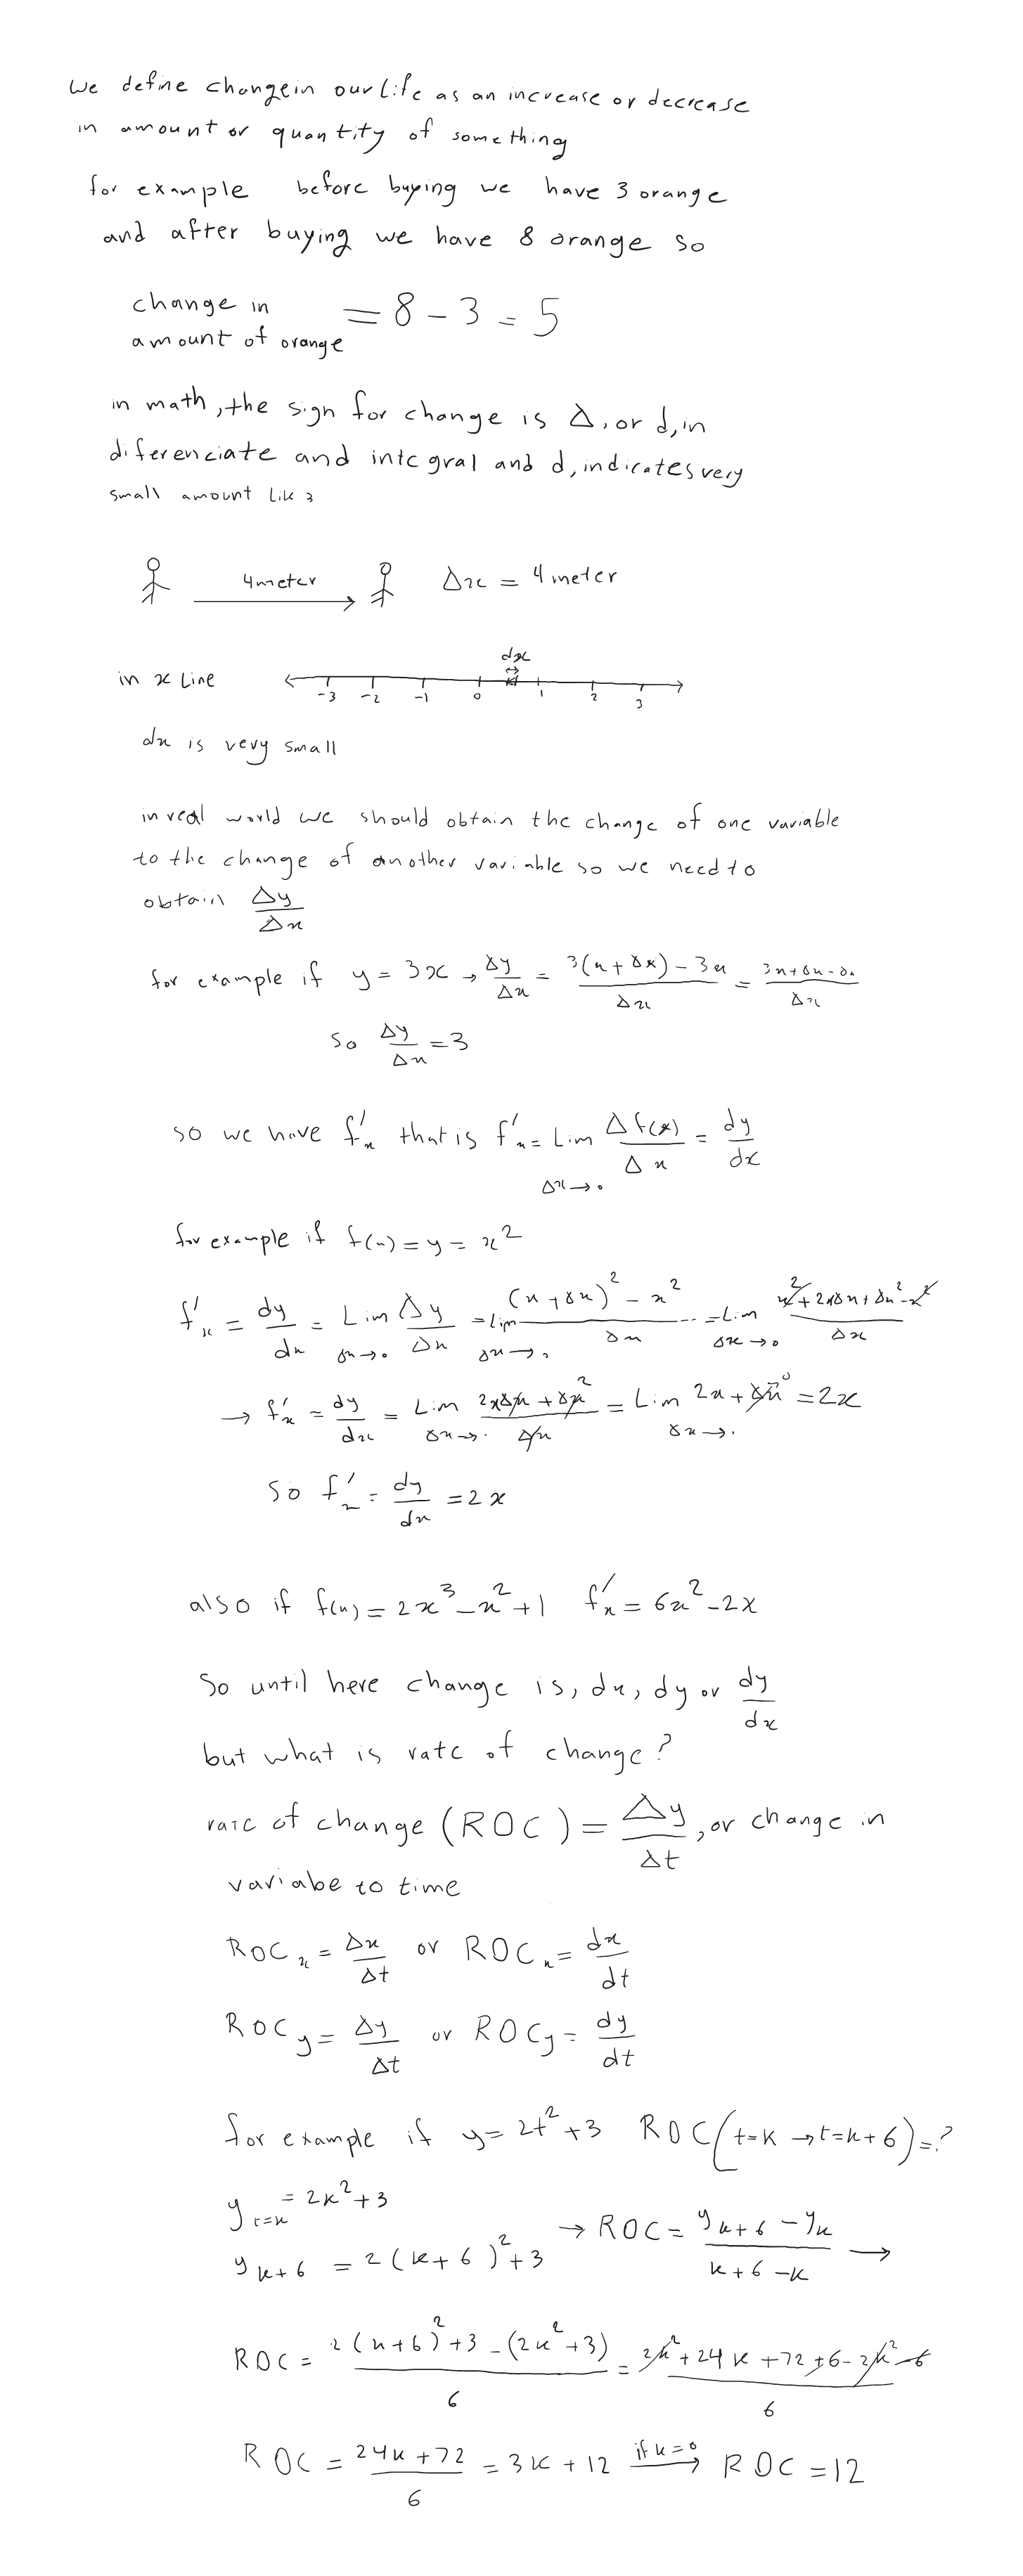
The rate of change measures how one quantity changes relative to another. In mathematics, it is often calculated using derivatives in calculus or the difference between two points in algebra. Here are the common methods to find the rate of change:
1. Average Rate of Change (Algebraic Approach)
The average rate of change between two points on a function is calculated as the slope of the line connecting the points. This is given by:
2. Instantaneous Rate of Change (Using Derivatives)
The instantaneous rate of change of a function at a specific point is the value of the derivative at that point.

This gives the slope of the tangent line to the curve at x=ax = ax=a, representing how the function changes at that exact point.

The rate of change in measured the change in Y over the change in X
I am a Cambridge Graduate (1st class BA) and a 4th yr medical student
2 reviews
Difference divided by the time.
In terms of a graph, this will be the change in the y-axis divided by the change in the x-axis (aka slope).
I'm available for 1:1 private online tuition!
Click here to view my profile and arrange a free introduction.Achieve top GCSE grades with expert tutoring from Imperial College
3 reviews
It is simply a total concerned amount divided by the total time. For example, if you want to find out rate of change of distance. You consider total distance covered by the vehicle and divide it by the total time it took for that change.
Rate of change of position = total covered distance / total taken time.
I'm available for 1:1 private online tuition!
Click here to view my profile and arrange a free introduction.This is easier to work out from a graph, the rate of change is the gradient of the line - the change in y divided by the change in x. However, you might not have time in exam conditions to draw a graph when it's not asked of you, so I would suggest picking two points of the data - ignoring outliers if there are any. Calculate the difference between them by taking them away from each other, then divide that by the difference in time between them. This will give you the rate of change.
5 years teaching STEM up to Degree level. Master's Graduate from KCL
47 reviews
In a graph of a value vs time, it would be the gradient. Otherwise simply divide the difference in any particular value by the time taken.
I'm available for 1:1 private online tuition!
Click here to view my profile and arrange a free introduction.An experienced tutor for science subjects and competitive exams
If you take the change in Y values and divide that with the change in X-values the result will be a rate of change,
I'm available for 1:1 private online tuition!
Click here to view my profile and arrange a free introduction.The rate of change (ROC) is how much the value of something changes over a period of time and it is given in percentage terms.
To find this you first calculate the change in "Y" values (or the change in an outcome variable) divided by the change in "X" values (or the change in input variables).
So if my tutoring time increases from 3 hours in week 1 to 16 hours in week 2 and my income increases from £45 per week to £240 per week, Y values are my income and X values are the work hours I put in. r
To calculate the ROC I would do the following.
(240 - 45) / (16 - 3) = 195 / 13 = 15% rate of change in my earnings between week 1 and week 2.
Experienced and enthusiastic Maths Tutor and Maths teacher of GCSE and
3 reviews
You would have to differentiate
I'm available for 1:1 private online tuition!
Click here to view my profile and arrange a free introduction.Friendly, Relaxed Physics and Maths tutoring
1 reviews
The rate of change in the most simple terms is the "change in something" divided by "the time it took to change". In GCSE maths this often comes up with speed and time graphs. If they ask you to find the rate of change at a certain time from a graph you first draw a tangent to the graph at that point then work out the gradient of that tangent. The gradient on a speed(velocity) - time graph is the rate of chenge of speed(velocity).
I'm available for 1:1 private online tuition!
Click here to view my profile and arrange a free introduction.University of Leeds Graduate student ready to teach all that is Maths!
The rate of change measures how a quantity changes over time or across space. It's often represented as the slope of a line connecting two points on a graph.
I'm available for 1:1 private online tuition!
Click here to view my profile and arrange a free introduction.Frays of change is how much x. Ganges w time or another variable . So this can be done by working out the gradient of a graph or differentiating If it is an expression
Distance traveled divided by time it takes. On a graph that would be calculating the difference in the change in y and the change in x
The rate of change (ROC) is the speed at which a variable changes over a specific period of time
Qualified Teacher to help you excel.
4 reviews
divide the change in y-values by the change in x-values
I'm available for 1:1 private online tuition!
Click here to view my profile and arrange a free introduction.Think you can help?

Need a GCSE Maths tutor?
Get started with a free online introductions with an experienced and qualified online tutor on Sherpa.
Find a GCSE Maths Tutor